The Education Quality and Accountability Office (EQAO):
Grade 9 Assessment of Mathematics
The Joy of the Teacher is the Success of the Students. – Samuel Chukwuemeka
Welcome to Our Site
I greet you this day,
These are the solutions to the Grade 9 released test questions from the Education Quality and Accountability
Office (EQAO).
Please review the formulas, rules/laws, and theorems on the website for each topic as applicable.
If time permits and there is sufficient interest, video solutions may be provided. Please subscribe to the
YouTube channel to be notified
of upcoming livestreams.
You are welcome to ask questions during the video livestreams.
If you find these resources valuable and if any of these resources were helpful in your passing the
Mathematics tests/exams, please consider making a donation:
Cash App: $ExamsSuccess or
cash.app/ExamsSuccess
PayPal: @ExamsSuccess or
PayPal.me/ExamsSuccess
Venmo: @ExamsSuccess or
Venmo.com/u/ExamsSuccess
Square: Exams Success
Buy Me a Coffee: Exams Success
Buy Me a Coffee @ Ko-Fi: Exams Success
Your donation is appreciated.
Comments, ideas, areas of improvement, questions, and constructive
criticisms are welcome.
Feel free to contact me. Please be positive in your message.
I wish you the best.
Thank you.
Grade 9 Formula Sheet
Grade 9 Formula Sheet (Large Print)
2025 Released Questions
(1.) B1: Development of Numbers and Number Sets: Five numbers are shown.
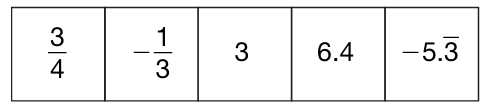
Select the TWO subsets of the number system that all of these numbers belong to.
A. the set of integers.
B. the set of irrational numbers
C. the set of rational numbers
D. the set of real numbers
A rational number is a number that can be written as a ratio of two integers such that the denominator is not zero.
Let us review each number.
$ \dfrac{3}{4} \text{ is a rational number: ratio of 3 to 4} \\[5ex] -\dfrac{1}{3} \text{ is a rational number: ratio of $–1$ to 3} \\[5ex] 3 = \dfrac{3}{1} \text{ is a rational number: ratio of 3 to 1} \\[5ex] 6.4 = \dfrac{64}{10} = \dfrac{32}{5} \text{ is a rational number: ratio of 32 to 5} \\[5ex] -5.\overline{3} \\[5ex] = -\left(5 + \dfrac{1}{3}\right) \\[5ex] = -\left(\dfrac{15 + 1}{3}\right) \\[5ex] = -\dfrac{16}{3} \\[5ex] \text{ is a rational number: ratio of $–16$ to 3} \\[5ex] $ All the numbers are rational numbers.
A real number is any rational or irrational number.
So, all rational numbers are real numbers.
All the numbers are rational numbers and real numbers.
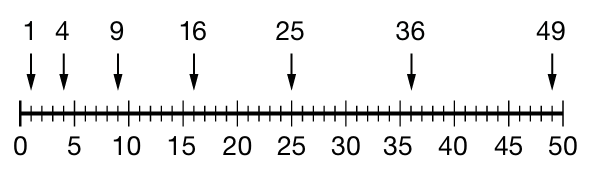
Select the statement that correctly compares the density of the set of positive integers between 0 and 50 and the set of perfect squares between 0 and 50.
A. Both sets are equally dense.
B. Both sets are equally dense and contain infinitely many numbers.
C. The set of positive integers is more dense than the set of perfect squares.
D. The set of positive integers is less dense than the set of perfect squares.
The density of a set of elements within a range is a measure of the ratio of the cardinality of the subset to the cardinality of the universal set.
$ \text{Density} = \dfrac{\text{n(elements of the set)}}{\text{n(sample space)}} \\[5ex] \underline{\text{Set of Positive Integers $\le$ 50}} \\[3ex] \text{Density} = \dfrac{50}{50} = 1 \\[5ex] \underline{\text{Set of Perfect Squares $\le$ 50}} \\[3ex] \text{Density} = \dfrac{7}{50} \\[5ex] 1 \gt \dfrac{7}{50} \\[3ex] $ Therefore, the set of positive integers is more dense than the set of perfect squares.
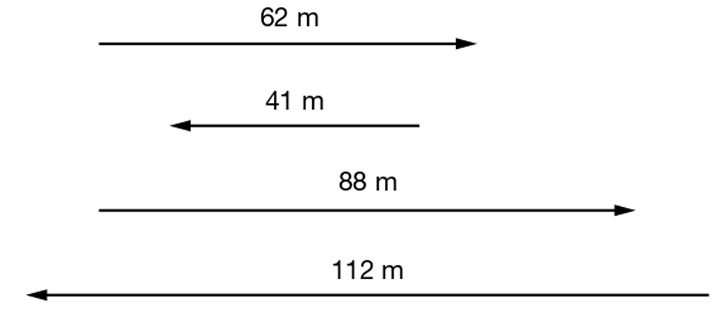
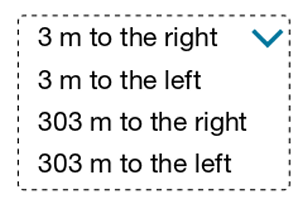
At his final position, where is the student in relation to his initial position?
The student is
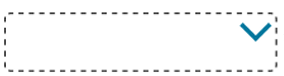 of his initial position.
Right arrow = positive
Left arrow = negative
Initial position: 1st arrow: 62 m right = +62
2nd arrow: 41 m left = –41
3rd arrow: 88 m right = +88
Final position: 4th arrow: 112 m left = –112
$ \text{Change} = 62 - 41 + 88 - 112 \\[3ex] = -3 \\[3ex] $ At his final position, the student is 3 m to the left of his initial position.
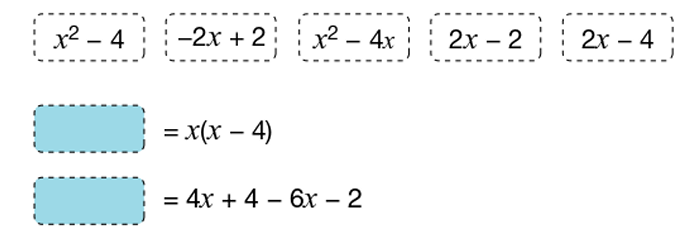
$ x(x - 4) \\[3ex] = x^2 - 4x \\[5ex] 4x + 4 - 6x - 2 \\[3ex] = 4x - 6x + 4 - 2 \\[3ex] = -2x + 2 $
        	output "Enter the width in centimetres."
        	store user input as width
        	output "Enter the length in centimetres."
        	store user input as length
        	perimeter = 2 * width + 2 * length
        	output perimeter, " cm"
Complete the statement. If a user inputs 21 as the width and
 as the
length, the output will be 60 cm.
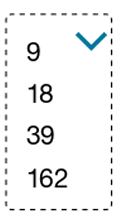
$ \text{perimeter} = 2 * \text{width} + 2 * \text{length} \\[3ex] \text{width} = 21\;cm \\[3ex] \text{perimeter} = 60\;cm \\[3ex] \implies \\[3ex] 60 = 2 * 21 + 2(\text{length}) \\[3ex] 2(\text{length}) + 42 = 60 \\[3ex] 2(\text{length}) = 60 - 42 \\[3ex] \text{length} = \dfrac{18}{2} \\[5ex] = 9\;cm $
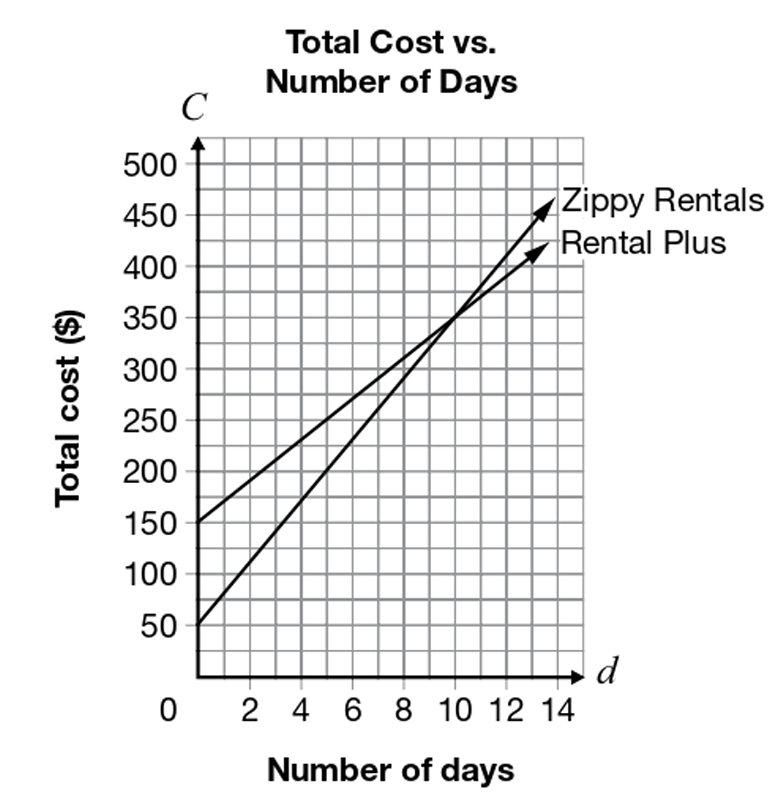
Which statement is true?
A. The initial cost at Rental Plus is $100 less than at Zippy Rentals.
B. A 10-day rental costs $350 at both Rental Plus and Zippy Rentals.
C. The difference in cost between Rental Plus and Zippy Rentals for a 10-day rental is $100.
D. A rental for more than 10 days costs less at Zippy Rentals than at Rental Plus.
Let us analyze the options until we get the correct one.
A. The initial cost at Rental Plus is $100 less than at Zippy Rentals.
The initial cost at Rental Plus is $150
The initial cost at Zippy Rentals is $50
The initial cost at Rental Plus is $(150 − 50 = 100) more (not less) than at Zippy Rentals.
Option A. is not true.
B. A 10-day rental costs $350 at both Rental Plus and Zippy Rentals.
This is true because the two graphs intersect at $350
Option B. is true.
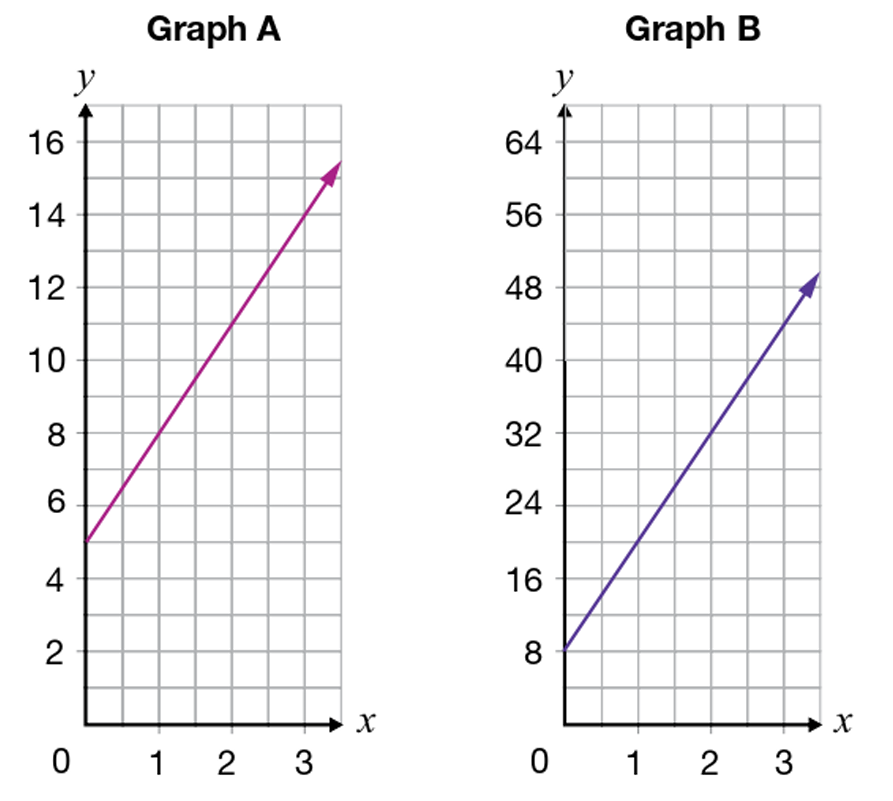
Complete this statement that compares the rates of change of Graph A and Graph B.
Graph
 has a rate of change that is
 times greater than the rate of change of
the other graph.
Observing the two graphs:
They have the same scale for the horizontal axis (x-axis).
However, in the scale of the vertical axis (y-axis):
the units on Graph B are four times the units on Graph A.
Because:
The slope is the measure of the change in the output, y with respect to the unit change in the input, x (otherwise known as the rate of change)
And the change in the input are the same for both graphs
But, the change in output for Graph B is four times the change in the corresponding output for Graph A;
Graph B has a rate of change that is four times the rate of change of Graph A.
Student: SamDom For Peace
Teacher: That's me. What's good?
Student: Could you please elaborate?
Could you show all work?
Teacher: Sure, let's do it.
Let us use the Slope Formula.
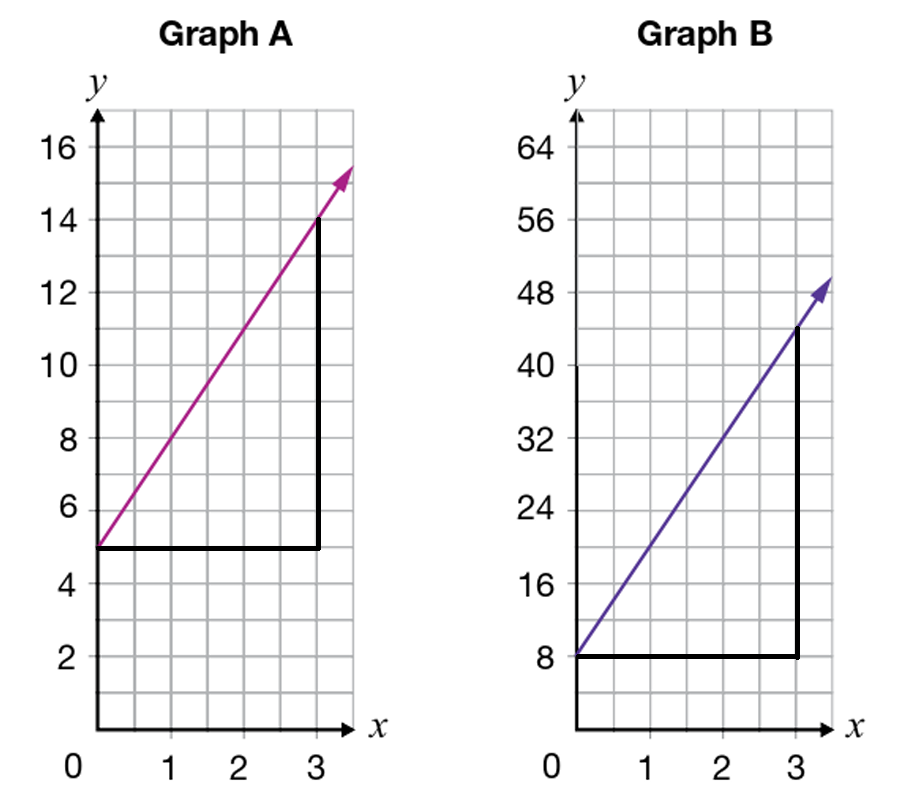
$ \text{slope} = \dfrac{\Delta y}{\Delta x} = \dfrac{y_2 - y_1}{x_2 - x_1} \\[5ex] \underline{\text{Graph A}} \\[3ex] \text{Point 1: } (0, 5) \\[3ex] x_1 = 0 \\[3ex] y_1 = 5 \\[5ex] \text{Point 2: } (3, 14) \\[5ex] x_2 = 3 \\[3ex] y_2 = 14 \\[5ex] \text{slope} = \dfrac{14 - 5}{3 - 0} \\[5ex] = \dfrac{9}{3} \\[5ex] = 3 \\[5ex] \underline{\text{Graph B}} \\[3ex] \text{Point 1: } (0, 8) \\[3ex] x_1 = 0 \\[3ex] y_1 = 8 \\[5ex] \text{Point 2: } (3, 44) \\[5ex] x_2 = 3 \\[3ex] y_2 = 44 \\[5ex] \text{slope} = \dfrac{44 - 8}{3 - 0} \\[5ex] = \dfrac{36}{3} \\[5ex] = 12 \\[5ex] 12 = 4 \times 3 \\[3ex] \text{slope for Graph B} = 4 \times \text{slope for Graph A} \\[3ex] $ The result confirms our earlier result.
Select the relationship that is non-linear.
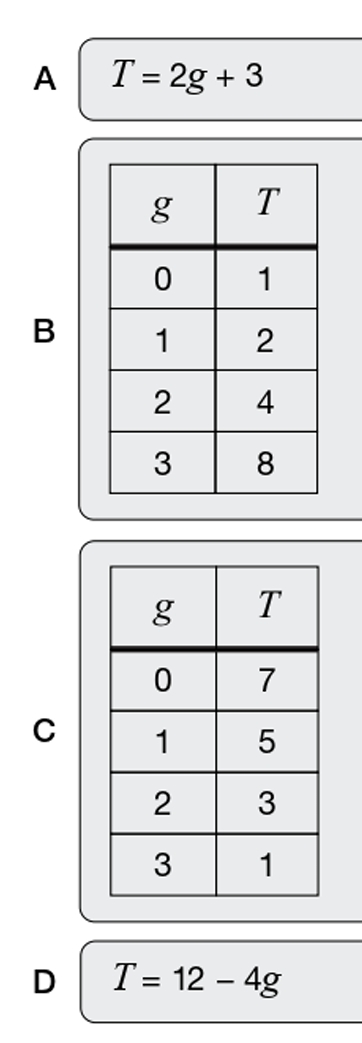
If the highest exponent of the independent variable in the function is 1, the function is linear.
Otherwise the function is non-linear.
In that regard, options A. and D. are linear.
If the slope between any two points on a function is the same, the function is linear.
Otherwise, the function is non-linear.
Let us analyze options B. and C.
$ \text{slope} = \dfrac{y_2 - y_1}{x_2 - x_1} \\[5ex] \underline{\text{Option B.}} \\[3ex] \text{Point 1: } (x_1, y_1) = (0, 1) \\[3ex] \text{Point 2: } (x_2, y_2) = (1, 2) \\[3ex] \text{slope} = \dfrac{2 - 1}{1 - 0} = \dfrac{1}{1} = 1 \\[5ex] \text{Point 1: } (x_1, y_1) = (1, 2) \\[3ex] \text{Point 2: } (x_2, y_2) = (2, 4) \\[3ex] \text{slope} = \dfrac{4 - 2}{2 - 1} = \dfrac{2}{1} = 2 \\[5ex] 1 \ne 2 \\[3ex] $ Option B. is not linear.
$ \underline{\text{Option C.}} \\[3ex] \text{Point 1: } (x_1, y_1) = (0, 7) \\[3ex] \text{Point 2: } (x_2, y_2) = (1, 5) \\[3ex] \text{slope} = \dfrac{5 - 7}{1 - 0} = -\dfrac{2}{1} = -2 \\[5ex] \text{Point 1: } (x_1, y_1) = (1, 5) \\[3ex] \text{Point 2: } (x_2, y_2) = (2, 3) \\[3ex] \text{slope} = \dfrac{3 - 5}{2 - 1} = -\dfrac{2}{1} = -2 \\[5ex] \text{Point 1: } (x_1, y_1) = (1, 5) \\[3ex] \text{Point 2: } (x_2, y_2) = (3, 1) \\[3ex] \text{slope} = \dfrac{1 - 5}{3 - 1} = -\dfrac{4}{2} = -2 \\[5ex] \text{Point 1: } (x_1, y_1) = (2, 3) \\[3ex] \text{Point 2: } (x_2, y_2) = (3, 1) \\[3ex] \text{slope} = \dfrac{1 - 3}{3 - 2} = -\dfrac{2}{1} = -2 \\[5ex] -2 = -2 = -2 = -2 \\[3ex] $ Option C. is linear.
(15.) D1: Collection, Representation, and Analysis of Data: The average temperatures in March and the latitudes for five communities in Ontario are shown on this grid.
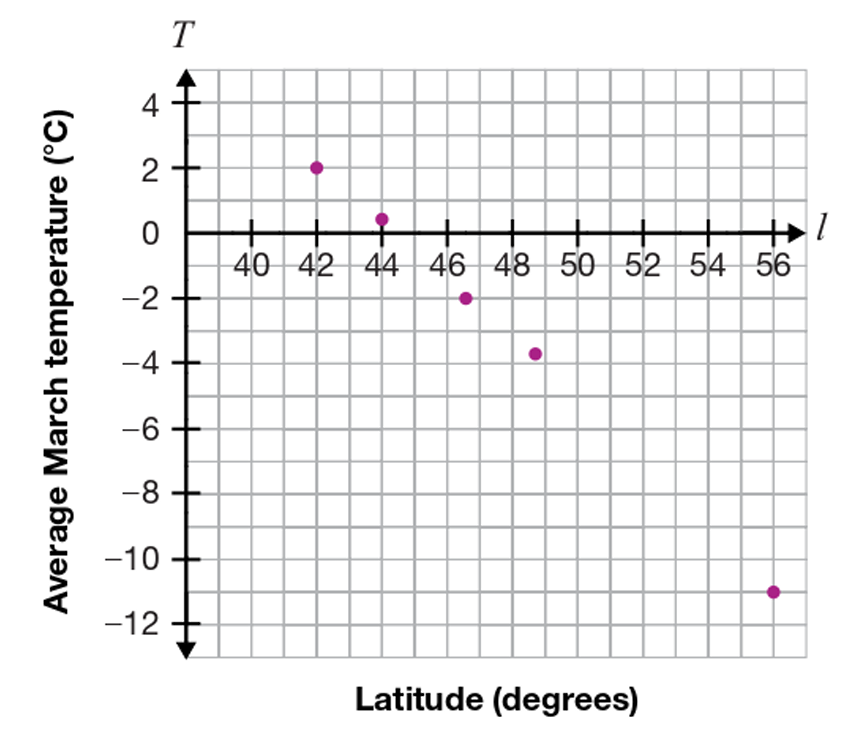
The information for four more communities is shown in this table.
| Ontario community | Latitude (degrees) | Average March temperature (°C) |
|---|---|---|
| Kenora | $50$ | $-6.3$ |
| Red Lake | $51$ | $-7.5$ |
| Timmins | $48$ | $-7$ |
| Brampton | $43$ | $1$ |
Which community in the table would be represented by a point on the grid that is an outlier to the data if all the data were included on the same grid?
A. Kenora
B. Red Lake
C. Timmins
D. Brampton
The Graph:
The graph shows an inverse proportional relationship between the Average March temperature (°C) and the Latitude (degrees)
In other words, as the latitude increases, the average March temperature decreases.
The Table: (Arranged in increasing order of the Latitudes)
| Ontario community | Latitude (degrees) | Average March temperature (°C) |
|---|---|---|
| Brampton | $43$ | $1$ |
| Timmins | $48$ | $-7$ |
| Kenora | $50$ | $-6.3$ |
| Red Lake | $51$ | $-7.5$ |
As the latitudes increases, the average March temperature decreases except for Timmins because $-7 \lt -6.3$
If all the data in the table were included on the same grid (as the graph), every Ontario community besides Timmins would follow that trend of decreasing average temperatures for increasing latitudes.
Hence, Timmins would be the outlier.
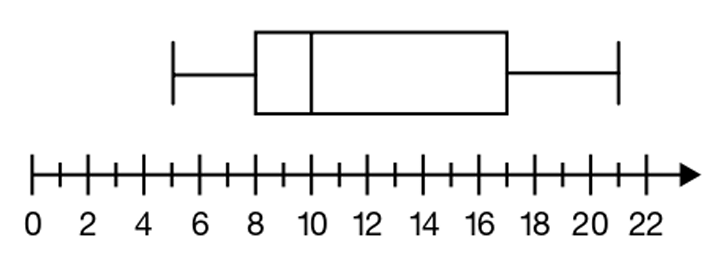
Select the TWO data sets that correspond to the box plot.
$ A.\;\; 5, 8, 9, 11, 17, 21 \\[3ex] B.\;\; 5, 6, 8, 9, 10, 11, 17, 21 \\[3ex] C.\;\; 5, 6, 8, 9, 11, 17, 19, 21 \\[3ex] D.\;\; 5, 6, 8, 8, 8, 9, 11, 12, 16, 18, 19, 21 \\[3ex] $
$ \underline{\text{Box and Whisker Plot}} \\[3ex] \underline{\text{Five – Number Summary}} \\[3ex] \text{minimum} = 5 \\[3ex] \text{lower quartile} = 8 \\[3ex] \text{median} = 10 \\[3ex] \text{upper quartile} = 17 \\[3ex] \text{maximum} = 21 \\[3ex] $ All the data sets have the same minmum and the same maximum.
So, let us check out their medians.
$ \text{Option A.} \\[3ex] 5, 8, 9, 11, 17, 21 \\[3ex] \text{median} = \dfrac{9 + 11}{2} \\[5ex] = \dfrac{20}{2} = 10 \\[5ex] \text{Option B.} \\[3ex] 5, 6, 8, 9, 10, 11, 17, 21 \\[3ex] \text{median} = \dfrac{9 + 10}{2} \\[5ex] = \dfrac{19}{2} \ne 10 \\[5ex] \text{Option C.} \\[3ex] 5, 6, 8, 9, 11, 17, 19, 21 \\[3ex] \text{median} = \dfrac{9 + 11}{2} \\[5ex] = \dfrac{20}{2} = 10 \\[5ex] \text{Option D.} \\[3ex] 5, 6, 8, 8, 8, 9, 11, 12, 16, 18, 19, 21 \\[3ex] \text{median} = \dfrac{9 + 11}{2} \\[5ex] = \dfrac{20}{2} = 10 \\[3ex] $ Option B. is eliminated.
Let us determine the first quartiles of the remaining options.
| If the $xth$ position | then, |
|---|---|
| is an integer |
$xth\text{ position} = \dfrac{xth\text{ position} + (x + 1)th\text{ position}}{2}$ In other words, find the value of the $xth$ position; find the value of the next position; and determine the mean of the two values. |
| is not an integer | $xth$ position is rounded up |
$ \text{sample size} = n \\[5ex] \text{lower quartile position} = \dfrac{n}{4}th \\[5ex] \text{Option A.} \\[3ex] 5, 8, 9, 11, 17, 21 \\[3ex] n = 6 \\[3ex] \text{lower quartile position} = \dfrac{6}{4}th \\[5ex] = 1.5th \approx 2nd \\[3ex] \text{lower quartile} = 2nd\text{ value} = 8 \\[5ex] \text{Option C.} \\[3ex] 5, 6, 8, 9, 11, 17, 19, 21 \\[3ex] n = 8 \\[3ex] \text{lower quartile position} = \dfrac{8}{4}th \\[5ex] = 2nd \\[3ex] \text{lower quartile} = \dfrac{2nd \text{ value} + 3rd \text{ value}}{2} \\[5ex] = \dfrac{6 + 8}{2} \\[5ex] = 7 \ne 8 \\[3ex] \text{Option D.} \\[3ex] 5, 6, 8, 8, 8, 9, 11, 12, 16, 18, 19, 21 \\[3ex] n = 12 \\[3ex] \text{lower quartile position} = \dfrac{12}{4}th \\[5ex] = 3rd \\[3ex] \text{lower quartile} = \dfrac{3rd \text{ value} + 4th \text{ value}}{2} \\[5ex] = \dfrac{8 + 8}{2} \\[5ex] = 8 \\[3ex] $ Option C. is eliminated.
Options A. and D. are the two datasets that represent the box plot.
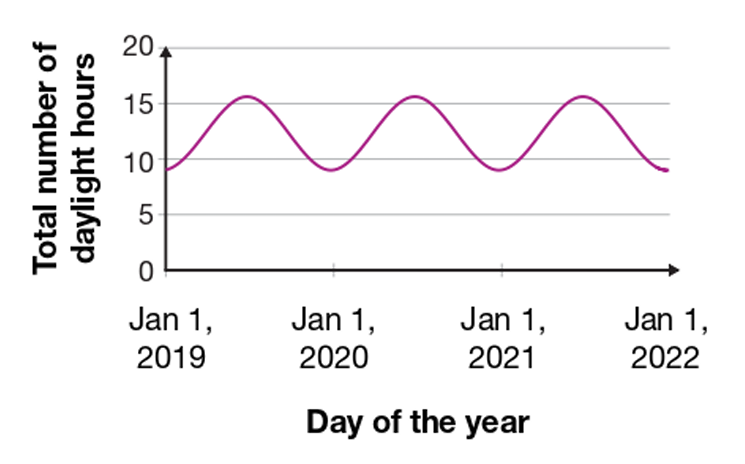
Based on this data, what is the maximum number of daylight hours in a day that would be expected in the year 2022?
$ A.\;\; 9\text{ hours} \\[3ex] B.\;\; 10\text{ hours} \\[3ex] C.\;\; 14\text{ hours} \\[3ex] D.\;\; 16\text{ hours} \\[3ex] $
Based on the observation of the graph, the maximum number of daylight hours in a day from:
Jan 1, 2019 to Jan 1, 2020
Jan 1, 2020 to Jan 1, 2021
Jan 1, 2021 to Jan 1, 2022
is more than 15 hours (about 16 hours).
Following this trend, the maximum number of daylight hours in a day that would be expected in the year 2022 (from Jan 1, 2022 to Jan 1, 2023) is about 16 hours.
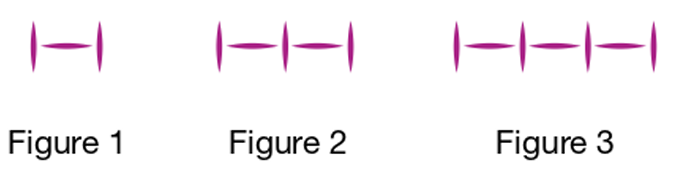
Which of these strategies would be quickest for the class to use when determining the correct number of toothpicks in the 4257th figure?
A. continuing the pattern with toothpicks
B. creating and extending a table of values
C. setting up an equation for this relationship
D. drawing a graph using the given figures and extrapolating
Figure 1: 1st term: 3 toothpicks
Figure 2: 2nd term: 5 toothpicks
Figure 3: 3rd term: 7 toothpicks
There is a pattern here: an Arithmetic Sequence, because it has a common difference: $7 - 5 = 5 - 3 = 2$ between consecutive terms.
The easiest way to find the 4257th term is to determine the nth term of the arithmetic sequence.
Then, we determine the number of terms (number of toothpicks) in the 4257th term.
The nth term of an Arithmetic Sequence is an equation.
(19.) E1: Geometric and Measurement Relationships: Which variable represents an angle that has a measure of 140°C?
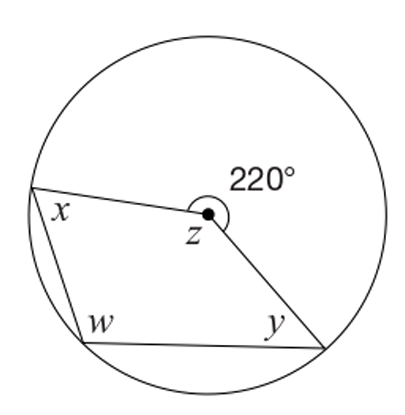
$ A.\;\; w \\[3ex] B.\;\; x \\[3ex] C.\;\; y \\[3ex] D.\;\; z \\[3ex] $
$ z + 220^\circ = 360^\circ \quad\angle s \text{ at a point} \\[3ex] z = 360 - 220 \\[3ex] z = 140^\circ $
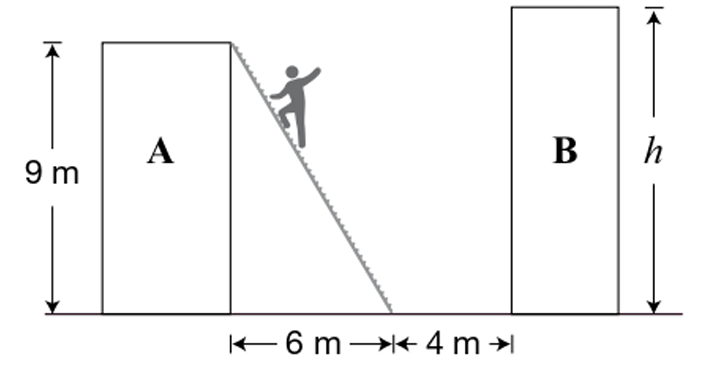
What is the exact height, h, of building B?
$ A.\;\; \sqrt{45}\;m \\[3ex] B.\;\; \sqrt{101}\;m \\[3ex] C.\;\; \sqrt{117}\;m \\[3ex] D.\;\; \sqrt{133}\;m \\[3ex] $
It is the same ladder.
The worker did not move the foot of the ladder.
This implies that the length of the ladder is the same.
We shall call the length of the ladder, the hypotenuse, hyp
Let us label the diagram accordingly
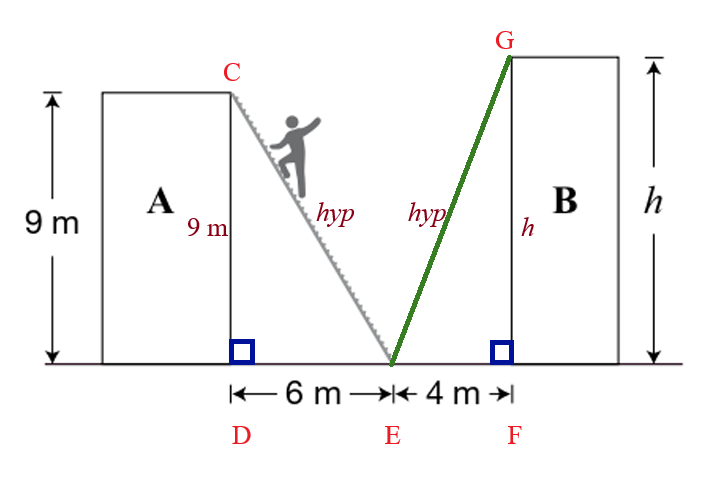
$ hyp^2 = leg^2 + leg^2 \quad(\text{Pythagorean Theorem}) \\[3ex] \underline{\triangle CDE} \\[3ex] hyp^2 = 9^2 + 6^2 \\[3ex] hyp^2 = 81 + 36 \\[3ex] hyp^2 = 117 \\[5ex] \underline{\triangle GEF} \\[3ex] hyp^2 = h^2 + 4^2 \\[3ex] 117 = h^2 + 16 \\[3ex] h^2 = 117 - 16 \\[3ex] h^2 = 101 \\[3ex] h = \sqrt{101}\;m $